Judo Clipper: Final V1 Model
September 2026
Architecture, model selection, validation results and held-out test evaluation for the final bidirectional LSTM throw-attempt classifier.
← Back to the Judo Clipper case study
Brief Summary of Model
The final v1 model is a bidirectional LSTM with a feed-forward classification head. Its purpose is to determine whether a given input clip of a judo match contains at least one throw attempt.
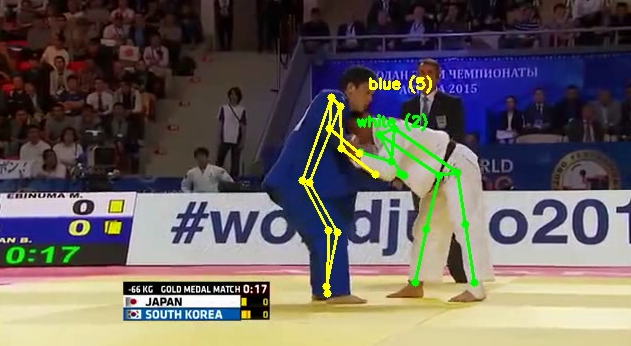
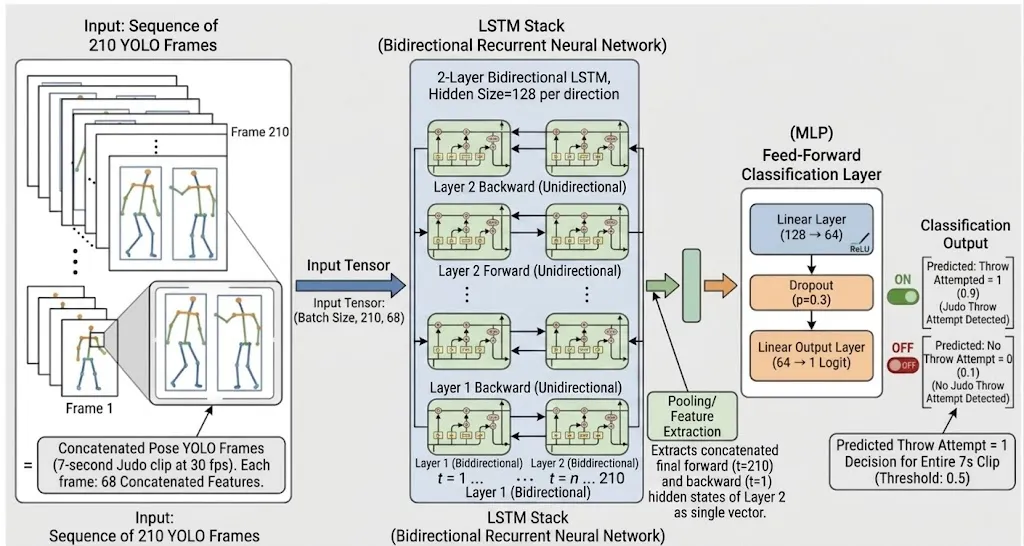
The model receives a sequence of 210 concatenated player pose vectors, each containing 68 features, with one vector for each frame in a 7-second clip.
Unlike the original unidirectional baseline, the final model processes the sequence in both temporal directions. The final forward and backward hidden states are concatenated and passed into the classification head.
The model produces one raw logit representing whether the complete clip contains a throw attempt. During evaluation or inference, the logit is converted into a probability and then into a binary prediction:
- Throw attempt = 1
- No throw attempt = 0
Architecture and Configurations
The final model consists of a two-layer bidirectional LSTM followed by a feed-forward classification head.
Each direction of the LSTM has a hidden size of 128. The final forward and backward hidden states are concatenated, creating a complete sequence representation that contains information from both temporal directions. The classification head projects this representation into one raw logit for the complete clip.
| Hyperparameter | Value | Description |
|---|---|---|
| Input Sequence Length | 210 | Number of frames in each input clip |
| Features Per Frame | 68 | Concatenated pose coordinates for both players |
| LSTM Hidden Size | 128 | Number of hidden-state features in each direction |
| LSTM Layers | 2 | Number of stacked recurrent layers |
| Bidirectional | True | Processes each sequence in both temporal directions |
| Classifier Hidden Size | 64 | Intermediate projection before the final logit |
| Dropout Rate | 0.30 | Regularisation applied within the configured architecture |
| Model Output | 1 | One raw logit for the complete clip |
Training Configurations
| Parameter | Value | Details |
|---|---|---|
| Epochs | 50 | Total passes over the training data |
| Batch Size | 32 | Number of sequences per batch |
| Optimiser | Adam | Optimisation algorithm used to update model parameters |
| Learning Rate | 0.001 | Base step size for the optimiser |
| Weight Decay | 0.0001 | L2 regularisation to penalise large weights |
| Maximum Gradient Norm | 1.00 | Clips the total gradient norm to limit unusually large parameter updates |
| Class Weighting Mode | Automatic | Calculates the positive-class weight from the training split |
| Resolved Positive-Class Weight | 1.7994 | Training no-attempt count divided by training attempt count |
| Random Seed | 42 | Seed used to support reproducible training |
| Checkpoint Selection | Lowest validation loss | Selects the best checkpoint using unweighted validation BCE |
The automatic positive-class weight was calculated using only the training split:
negative training samples / positive training samples = 1,112 / 618 ≈ 1.7994
The training objective used weighted BCEWithLogitsLoss, causing errors on throw-attempt clips to contribute more strongly during optimisation.
Validation loss was calculated using ordinary unweighted BCEWithLogitsLoss. This allowed validation loss and checkpoint selection to remain comparable with the previous experiments.
Gradient clipping was applied after backpropagation and before each optimiser step. When the total gradient norm exceeded 1.0, the gradients were scaled down before the model parameters were updated.
Gradient clipping and class weighting are training procedures only. They are not required when the trained model is used for production inference.
Dataset Split
The dataset was divided into stratified training, validation, and test splits using scikit-learn with a random seed of 42.
The resulting split assignments were frozen and persisted in splits/dataset_v1_stratified_seed_42.csv so that every experiment used exactly the same clips.
The proportions were:
| Split | Fraction (%) | Split File / Strategy | Details / Purpose |
|---|---|---|---|
| Train | 80% | splits/dataset_v1_stratified_seed_42.csv (Seed: 42) | Model training and parameter updates |
| Validation | 10% | splits/dataset_v1_stratified_seed_42.csv (Seed: 42) | Architecture selection and threshold selection |
| Test | 10% | splits/dataset_v1_stratified_seed_42.csv (Seed: 42) | Final unbiased performance evaluation |
Given that the dataset contained 2,163 clips, the raw counts of the split were:
| Class | Training | Validation | Test | Total |
|---|---|---|---|---|
| No attempt | 1,112 | 139 | 139 | 1,390 |
| Throw attempt | 618 | 77 | 78 | 773 |
| Overall total | 1,730 | 216 | 217 | 2,163 |
Model Development and Selection
The final model was selected through a series of controlled experiments.
Every experiment used:
- The same dataset
- The same frozen split
- The same random seed
- The same 50-epoch training budget
- The same optimiser, learning rate, and weight decay
- Checkpoint selection using the lowest validation loss
- Threshold selection using the validation split only
The test split was not used to choose between experiments.
Summary of Validation Results
| Experiment | Best Epoch | Validation Loss | Threshold | Accuracy | Attempt Precision | Attempt Recall | Attempt F1 | Macro F1 | FP |
|---|---|---|---|---|---|---|---|---|---|
| Original unidirectional baseline | 42 | 0.4941 | 0.53 | 0.7685 | 0.6421 | 0.7922 | 0.7093 | 0.7585 | 34 |
| Unidirectional with gradient clipping | 40 | 0.4298 | 0.45 | 0.8241 | 0.7468 | 0.7662 | 0.7564 | 0.8094 | 20 |
| Bidirectional with gradient clipping | 22 | 0.3990 | 0.34 | 0.8333 | 0.7531 | 0.7922 | 0.7722 | 0.8204 | 20 |
| Bidirectional, clipping, and automatic weighting | 26 | 0.4006 | 0.55 | 0.8472 | 0.7619 | 0.8312 | 0.7950 | 0.8366 | 20 |
Gradient clipping produced the largest individual improvement over the original baseline. It substantially reduced false positives and improved both attempt F1 and macro F1.
Bidirectionality then produced a smaller additional improvement. The bidirectional model correctly identified two more attempt clips than the clipped unidirectional model without increasing false positives.
Finally, automatic positive-class weighting correctly identified another three attempt clips without adding false positives. This produced the highest validation attempt F1, macro F1, and overall accuracy of all the experiments.
The bidirectional model with gradient clipping and automatic positive-class weighting was therefore selected as the final v1 model.
Results
Results of Training
Diagram of Training Losses
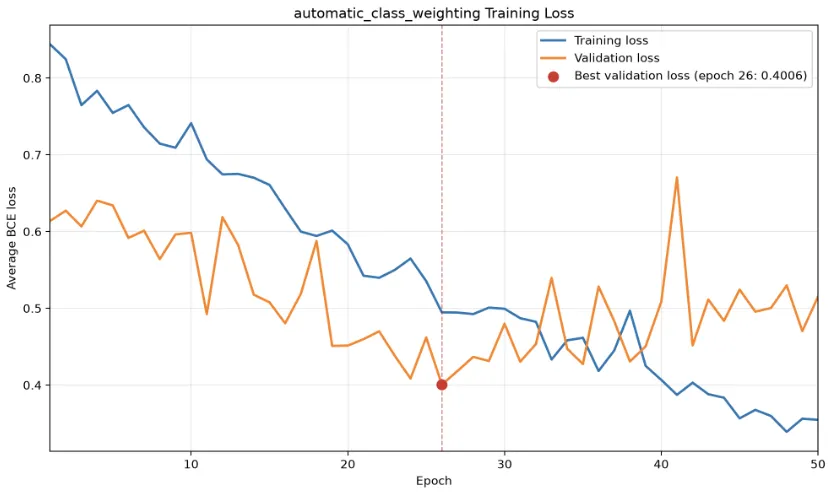
The training and validation curves represent different loss objectives for the final model:
- Training loss is weighted binary cross-entropy.
- Validation loss is ordinary unweighted binary cross-entropy.
Their numerical values should therefore not be compared directly.
The lowest unweighted validation loss occurred at epoch 26. After this point, the weighted training loss continued to decrease while validation loss became more volatile and broadly worsened.
The best-checkpoint policy handled this by retaining the checkpoint from epoch 26 rather than using the final model state from epoch 50.
Results of Evaluation Using the Validation Dataset Split
Evaluation Policy
The model returns raw logits. During evaluation, sigmoid converts the logits into probabilities.
A threshold of 0.50 was used as the initial reference, after which the classification threshold was selected using the validation split. The selected threshold maximised attempt F1 according to the predefined tie-breaking policy.
This selected a threshold of 0.55.
The checkpoint from epoch 26 was used because it achieved the lowest unweighted validation loss.
Validation Results
Model & Checkpoint Configuration
| Parameter | Value |
|---|---|
| Split | validation |
| Checkpoint | best |
| Checkpoint Epoch | 26 |
| Checkpoint Validation Loss | 0.4006 |
| Classification Threshold | 0.5500 (validation-selected) |
Dataset Counts
| Metric | Count |
|---|---|
| Total Samples | 216 |
| Actual Attempts | 77 |
| Actual No-Attempts | 139 |
Confusion Matrix
Breakdown
| Metric | Count |
|---|---|
| True Positives (TP) | 64 |
| True Negatives (TN) | 119 |
| False Positives (FP) | 20 |
| False Negatives (FN) | 13 |
2×2 Matrix View
| Predicted: Attempt | Predicted: No-Attempt | |
|---|---|---|
| Actual: Attempt | 64 (TP) | 13 (FN) |
| Actual: No-Attempt | 20 (FP) | 119 (TN) |
Classification Metrics
Overall Performance
- Accuracy:
0.8472(84.72%) - Macro F1:
0.8366
Per-Class Metrics
| Class | Precision | Recall | F1-Score |
|---|---|---|---|
| Attempt | 0.7619 | 0.8312 | 0.7950 |
| No-Attempt | 0.9015 | 0.8561 | 0.8782 |
Final Evaluation Using the Held-Out Test Split
After model and threshold selection had been completed, the final model was evaluated once on the held-out test split.
The checkpoint remained fixed at epoch 26 and the classification threshold remained fixed at the validation-selected value of 0.55.
No model selection, checkpoint selection, or threshold selection was performed using the test split.
Test Results
Model & Checkpoint Configuration
| Parameter | Value |
|---|---|
| Split | test |
| Checkpoint | best |
| Checkpoint Epoch | 26 |
| Checkpoint Validation Loss | 0.4006 |
| Classification Threshold | 0.5500 (fixed) |
Dataset Counts
| Metric | Count |
|---|---|
| Total Samples | 217 |
| Actual Attempts | 78 |
| Actual No-Attempts | 139 |
Confusion Matrix
Breakdown
| Metric | Count |
|---|---|
| True Positives (TP) | 62 |
| True Negatives (TN) | 116 |
| False Positives (FP) | 23 |
| False Negatives (FN) | 16 |
2×2 Matrix View
| Predicted: Attempt | Predicted: No-Attempt | |
|---|---|---|
| Actual: Attempt | 62 (TP) | 16 (FN) |
| Actual: No-Attempt | 23 (FP) | 116 (TN) |
Classification Metrics
Overall Performance
- Accuracy:
0.8203(82.03%) - Macro F1:
0.8084
Per-Class Metrics
| Class | Precision | Recall | F1-Score |
|---|---|---|---|
| Attempt | 0.7294 | 0.7949 | 0.7607 |
| No-Attempt | 0.8788 | 0.8345 | 0.8561 |
Comparison of Validation and Test Results
| Metric | Validation | Test | Change |
|---|---|---|---|
| Accuracy | 0.8472 | 0.8203 | −0.0269 |
| Attempt precision | 0.7619 | 0.7294 | −0.0325 |
| Attempt recall | 0.8312 | 0.7949 | −0.0363 |
| Attempt F1 | 0.7950 | 0.7607 | −0.0343 |
| No-attempt precision | 0.9015 | 0.8788 | −0.0227 |
| No-attempt recall | 0.8561 | 0.8345 | −0.0216 |
| No-attempt F1 | 0.8782 | 0.8561 | −0.0221 |
| Macro F1 | 0.8366 | 0.8084 | −0.0282 |
Analysis of Results
Analysis of Training
The final model learned more consistently than the original baseline because gradient clipping limited unusually large parameter updates.
The lowest unweighted validation loss occurred at epoch 26. After this point, the continued reduction in weighted training loss was not accompanied by an improvement in validation loss. This suggests that the model began to overfit after its best epoch.
The best-checkpoint policy correctly retained the model state from epoch 26.
Increasing the training budget beyond 50 epochs is unlikely to improve validation performance based on the observed loss curve.
Analysis of Validation Results
The final model correctly classified 64 of the 77 attempt clips in the validation split, producing an attempt recall of 0.8312.
It also correctly classified 119 of the 139 no-attempt clips. Its 20 false positives were substantially lower than the original baseline’s 34 false positives.
The final model achieved:
- Attempt F1 of
0.7950 - Macro F1 of
0.8366 - Overall accuracy of
0.8472
These were the strongest validation classification results produced during the controlled experiments.
Analysis of Final Test Results
Performance was moderately lower on the held-out test split than on the validation split.
Attempt F1 decreased from 0.7950 to 0.7607, while macro F1 decreased from 0.8366 to 0.8084. Overall accuracy decreased from 0.8472 to 0.8203.
Despite this reduction, the model retained useful classification performance on previously unseen clips. It correctly identified 62 of the 78 throw-attempt clips and correctly rejected 116 of the 139 no-attempt clips.
The difference between validation and test performance indicates that the validation results were somewhat optimistic. This is expected because the validation split was used for architecture selection, checkpoint selection, and threshold selection.
The held-out test result is accepted as the final performance estimate. No further model or threshold selection will be performed in response to the test result.
Known Limitations
The final model has several known limitations:
- The dataset contains only 2,163 accepted clips.
- The validation and test splits contain 216 and 217 clips respectively, so individual classification errors can noticeably affect the reported metrics.
- The current training manifest does not include source bout or video grouping. The split is therefore stratified but not group-aware, meaning clips from the same source may potentially appear in different splits.
- Model performance depends on the quality of the upstream pose estimation, tracking, player assignment, interpolation, and quality-assessment pipeline.
- The input contract requires a fixed sequence length of 210 frames and 68 features per frame.
- The classification threshold was selected using the same validation split used to compare experiments, which may make validation performance somewhat optimistic.
- Deterministic player A/B ordering has not been fully resolved. This does not change the binary clip-level label, but it remains a blocker for future player-specific classification.
Final Model Decision
The final v1 model is the bidirectional LSTM trained with gradient clipping and automatic positive-class weighting.
The selected production configuration is:
- Two-layer bidirectional LSTM
- LSTM hidden size of 128 per direction
- Classifier hidden size of 64
- Dropout rate of 0.30
- Best checkpoint from epoch 26
- Fixed classification threshold of 0.55
- Input contract of
[210, 68],float32 - One raw output logit for the complete clip
The final held-out test performance is:
- Accuracy:
0.8203 - Attempt F1:
0.7607 - Attempt recall:
0.7949 - Macro F1:
0.8084
Next Steps
The next step is to export the selected checkpoint as a clean production release bundle.
The release bundle should contain:
- Clean production model weights
- Model architecture configuration
- Input shape and dtype contract
- Fixed classification threshold of 0.55
- Binary label mapping
- Model and dataset version information
- Release metadata required to reproduce inference
A production inference wrapper will then be implemented. It will load the release bundle, accept one [210, 68] float32 NumPy array, validate the input, run the model in evaluation mode, and return:
- The raw logit
- The sigmoid probability
- The binary prediction produced using the fixed threshold of 0.55